BioCyc
Current Database:   
Search in Current Database: 
  • Extensive, Highly Curated Data

    BioCyc integrates genome data with a comprehensive body of additional data including metabolic reconstructions, regulatory networks, protein features, orthologs, gene essentiality, and atom mappings.

    Learn More

    Portion of Genome Browser

    Genome Browser image

  • A Vast Set of Bioinformatics Tools

    Browsers for genomes, metabolic networks, and regulatory networks. Transcriptomics and metabolomics data analysis, comparative analysis, and metabolic route search. Sequence search and alignment.

    Learn More

    Collage of screenshots of portions of
			   4 different BioCyc Tools. Upper left: the Regulatory
			   Overview, with some connections
			   shown. Upper right: the Cellular Overview
			   with omics data overlaid. Lower left: the
			   Omics Dashboard. Lower right: the
			   Comparative Genome Browser.


  • Explore Saccharomyces cerevisiae Metabolic Maps

    The Cellular Overview enables you to browse through zoomable metabolic map diagrams that are customized to each BioCyc organism.

    Learn More

    a
			   portion of a Cellular Overview diagram,
			   showing several pathway classes

    Cellular Overview image generated by Pathway Tools.

  • RouteSearch: Search for Paths Through the Metabolic Network

    Search for lowest-cost paths through the metabolic network of the selected organism.

    Learn More

    a schematic showing 3 hypothetical
			   routes from one compound to another, one
			   that is very long, one that is short but
			   most of the atoms from the starting compound
			   do not end up in the target compound, and
			   the best route, which is intermediate in
			   length but conserves the atoms in the
			   starting compound.


  • Metabolic Reconstruction from Sequenced Genomes

    Install SRI's Pathway Tools software (free to academics) to predict metabolic pathways for sequenced genomes, generate metabolic models.

    Learn More

    Two men looking at two screens, one
			   showing a genome browser display, the other a
			   regulatory overview display. Behind the
			   screens is a blue background with a portion
			   of a cellular overview diagram visible.


  • Gene Expression Data Analysis

    Multiple tools are available in this website for analysis of gene expression data.

    Learn More

    a portion of a cellular overview diagram,
			   overlaid with a gene expression time series
			   dataset. Detail popups are shown for three
			   reactions in three different styles: a bar
			   chart, a heatmap, and a line graph.

    Cellular Overview Omics Viewer image generated by Pathway Tools.

  • Comparative Genome Analysis

    Multiple comparative analysis tools are available in this website.

    Learn More

    A fragment of a Comparative Genome
			     Browser display showing the region around
			     the trpA gene for 5 E. coli
			     strains. Orthologous genes are colored
			     the same color in each strain.

    Multi-organism Genome Browser image generated by Pathway Tools.

  • Search Databases by Organism Properties

    BioCyc contains data on phenotypic properties of organisms, such as human-microbiome body site, aerobicity, and temperature range.

    Learn More

    Stock photo of several red rod-shaped
			 bacteria with yellow cilia and flagella

    Image by Arek Socha from Pixabay

  • The BioCyc Database Collection

    Tier 1 databases such as EcoCyc are the most highly curated. BioCyc databases are computationally derived from MetaCyc.

    Learn More

        Request Addition of New Genome to BioCyc
    Diagram of three tiers of Databases within BioCyc

    BioCyc Database Collection

  • The Omics Dashboard: A New View of Omics Data

    Visualize omics data as a set of graphs hierarchically organized by functional category. Drill down for more detail in areas of interest.

    Learn More

    A portion of an Omics Dashboard display,
				showing panels for Biosynthesis and
				Degradation, and a popup showing details
				for L-alanine biosynthesis.

    Cellular Dashboard image generated by Pathway Tools.

Saccharomyces cerevisiae Pathway/Genome Database

Image of Saccharomyces cerevisiae organism

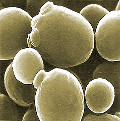
YeastCyc is a Pathway/Genome Database of the model eukaryote Saccharomyces cerevisiae S288c. In addition to genomic information, the database contains metabolic pathway, reaction, enzyme, and compound information, which has been manually curated from the scientific literature. The curation process includes periodic updates to the metabolites, reactions and pathways from the current version of MetaCyc to ensure compatibility with other members of the MetaCyc family of databases. YeastCyc has been curated from 47,000 publications. For details on recent curation, please click here.

This site includes extensive retrieval, visualization and analysis tools, including a genome browser and a metabolic map diagram. There are tools for analysis of gene expression, metabolomics and ChIP-chip data. You can search and align sequences for Saccharomyces cerevisiae and other microbial genomes and perform comparative analysis. You can store groups of genes and pathways into a SmartTable, and then browse, analyze and share with other users.

What people are saying <  ···  >


Learning Library

Tutorial Series

Tutorial #1: Introduction to BioCyc
These six sequential segments, giving you a guided tour of the BioCyc collection in concise bites. To download or view, just click on one of the links following each segment's name.
Tutorial #2: Introduction to SmartTables
The following tutorial will guide you through SmartTables, which enable you to create, upload, share, and analyze sets of genes, metabolites, pathways, and sequence sites. The tutorial is broken up into parts, ranging from basic operations to more advanced uses such as gene expression analysis and metabolomics. To download or view, click one of the links below.
Tutorial #3: Zoomable Metabolic Map, Comparative Tools, Regulatory Network
This tutorial introduces users to many of the advanced tools available on the BioCyc.org website for navigating cellular networks, analyzing large-scale datasets, and comparing organisms.
Tutorial #4: Omics Data Analysis
This tutorial will show you how to use BioCyc's tools for omics data analysis, including the cellular omics viewer, the omics dashboard, and other tools.
Tutorial #5: Pathway Collages
Pathway collages are multi-pathway diagrams that you can customize by, for example, overlaying omics data, altering the relative positions of pathways, and modifying connections among pathways. Learn how to generate, customize and export high-quality pathway-collage diagrams showing collections of user-specified pathways.
Tutorial #6: Creating a Pathway/Genome Database
Learn the entire process of building a BioCyc-like Pathway/Genome Database (PGDB) for an organism with a sequenced and annotated genome. Build a PGDB for your own lab or for the whole scientific community.
Tutorial #7: Using the Structured Advanced Query Page
An introduction to the Structured Advanced Query Page, which allows complex queries and queries across one or more databases in the BioCyc collection. You'll learn about:The basic steps of setting up an advanced query; Four examples of increasingly complex queries, including how to query across multiple databases; Where to learn more about the structure of BioCyc databases.