Introduction to BioCyc Genome and Metabolic Pathway Web Portal
The BioCyc web portal from SRI International contains databases for more than 20,000 sequenced organisms including humans, model eukaryotes, and thousands of bacteria. Each database integrates a diverse range of data including genome and metabolic pathway data, and provide a high level of accuracy via curation from 167,000 publications. The BioCyc suite of 60+ bioinformatics tools includes a genome browser, a metabolic network browser, and tools for metabolomics data analysis, transcriptomics data analysis, and metabolic route search.
For more information please see the BioCyc Data Sheet, the BioCyc overview video, and a comparison of BioCyc to KEGG.
Purchase BioCyc Subscription
A subscription is required for ongoing access to BioCyc. Click a button below for pricing information.
Does your institution already have access? View our current list of institutional subscribers.
BioCyc Benefits and Features
- BioCyc Benefits: Better Science, Faster
- BioCyc Data Content
- Genome Informatics Tools
- Pathway Informatics Tools
- Transcriptomics Data Analysis Tools
- Metabolomics Data Analysis Tools
- Advanced Data Access
BioCyc Benefits: Better Science, Faster
Faster Science
- Skip the Literature Search: Expert-curated mini-reviews distill
thousands of papers, saving you hours of manual synthesis and
reconciliation of conflicts
- Harmonized Data Ecosystem: A massive integration of
data eliminates the friction of navigating fragmented databases
- Programming-Free Discovery: BioCyc SmartTables deliver point-and-click
analytics -- no programming required
- Unique Visualizations: Publication-quality pathway
visualizations and a genome browser that zooms to the sequence level
in seconds
Better Science
- Superior Outcomes: Don't let annotation errors
found in public genome databases compromise your research. BioCyc
curators correct hundreds of incorrect annotations per genome to provide a solid
foundation of curated data. More accurate annotations drive
higher-quality hypotheses, more compelling publications, and more
competitive grant proposals.
- Deep Contextualization: Understand gene function through the
lens of complete metabolic and regulatory networks, not just isolated
sequences.
-
Unique tools for modern biology:
- Pathway and subsystem-based metabolomics analysis
- Transcriptomics and proteomics mapped onto zoomable metabolic charts
- Optimized pathway design for metabolic engineering
- Comparative analysis of genomes and pathways for multiple organisms and strains
Pathway/Genome Web Portal for 20,000 Organisms
BioCyc contains 20,000 Pathway/Genome Databases (PGDBs) including 79 curated databases. Eukaryotic databases in BioCyc include the following (bold PGDBs are curated): Homo sapiens, Rattus norvegicus, Mus musculus, Caenorhabditis elegans, Drosophila melanogaster, Saccharomyces cerevisiae, and Arabidopsis thaliana. BioCyc releases occur three times per year.
Computationally Generated Databases -- Tier 3
PGDBs are generated by combining an annotated genome with computationally inferred information and data imported from other databases, which can include:
- The genome, Gene Ontology terms, gene essentiality data
- Protein complexes, protein subcellular locations, protein features, Pfam domains, orthologs
- Metabolic pathways, reactions (including atom mappings), and metabolites
- Operons, transcription start sites, transcription factor binding sites, terminators, regulatory interactions
- Database links
Manually Curated Databases -- Tiers 1 and 2
Manual curation integrates extensive information from the literature including experimentally determined genome annotations; metabolic pathways, reactions, and metabolites; protein complexes; enzyme activators, inhibitors, cofactors, and kinetic parameters; and transcriptional regulatory interactions and binding sites. Curators have written thousands of pages of mini-review summaries that distill key findings from the literature.Click for a full list of the Tier 1 and Tier 2 curated databases, which include the following.
- EcoCyc: The data in this Escherichia coli K-12 MG1655 database have been gathered during two decades of literature-based curation from more than 45,000 articles. EcoCyc describes the metabolic, transport, and regulatory machinery of E. coli. EcoCyc curators have authored the equivalent of 4,013 textbook-pages of mini-review summaries for E. coli genes and pathways.
- MetaCyc: Contains 3,264 metabolic pathways and 20,039 biochemical reactions from all domains of life. MetaCyc information was gathered from 80,000 publications to provide a comprehensive metabolic encyclopedia whose mini-review summaries encompass the equivalent of 11,000 textbook pages.
- YeastCyc: This highly curated metabolic network for Saccharomyces cerevisiae was curated from 47,000 publications.
- HumanCyc: This database was derived from a computational pathway analysis of the human genome, followed by literature-based curation of human pathways and enzymes.
- BsubCyc: The curated metabolic and regulatory networks for this Bacillus subtilis database cite 7,000 publications. Included are 180 regulatory genes controlling 1,200 regulated genes.
- Mycobacterium tuberculosis H37Rv, Staphylococcus epidermidis RP62A, Synechocystis sp. PCC 6803, Brucella ovis ATCC 25840, Helicobacter pylori 26695, Chlamydia trachomatis D/UW-3/CX, Vibrio cholerae N16961, Corynebacterium glutamicum ATCC 13032, Peptoclostridium difficile 630, and others.
Genome Informatics Tools
Genome Informatics Tools include sequence retrieval, BLAST search, sequence pattern search, and multiple-sequence alignment.
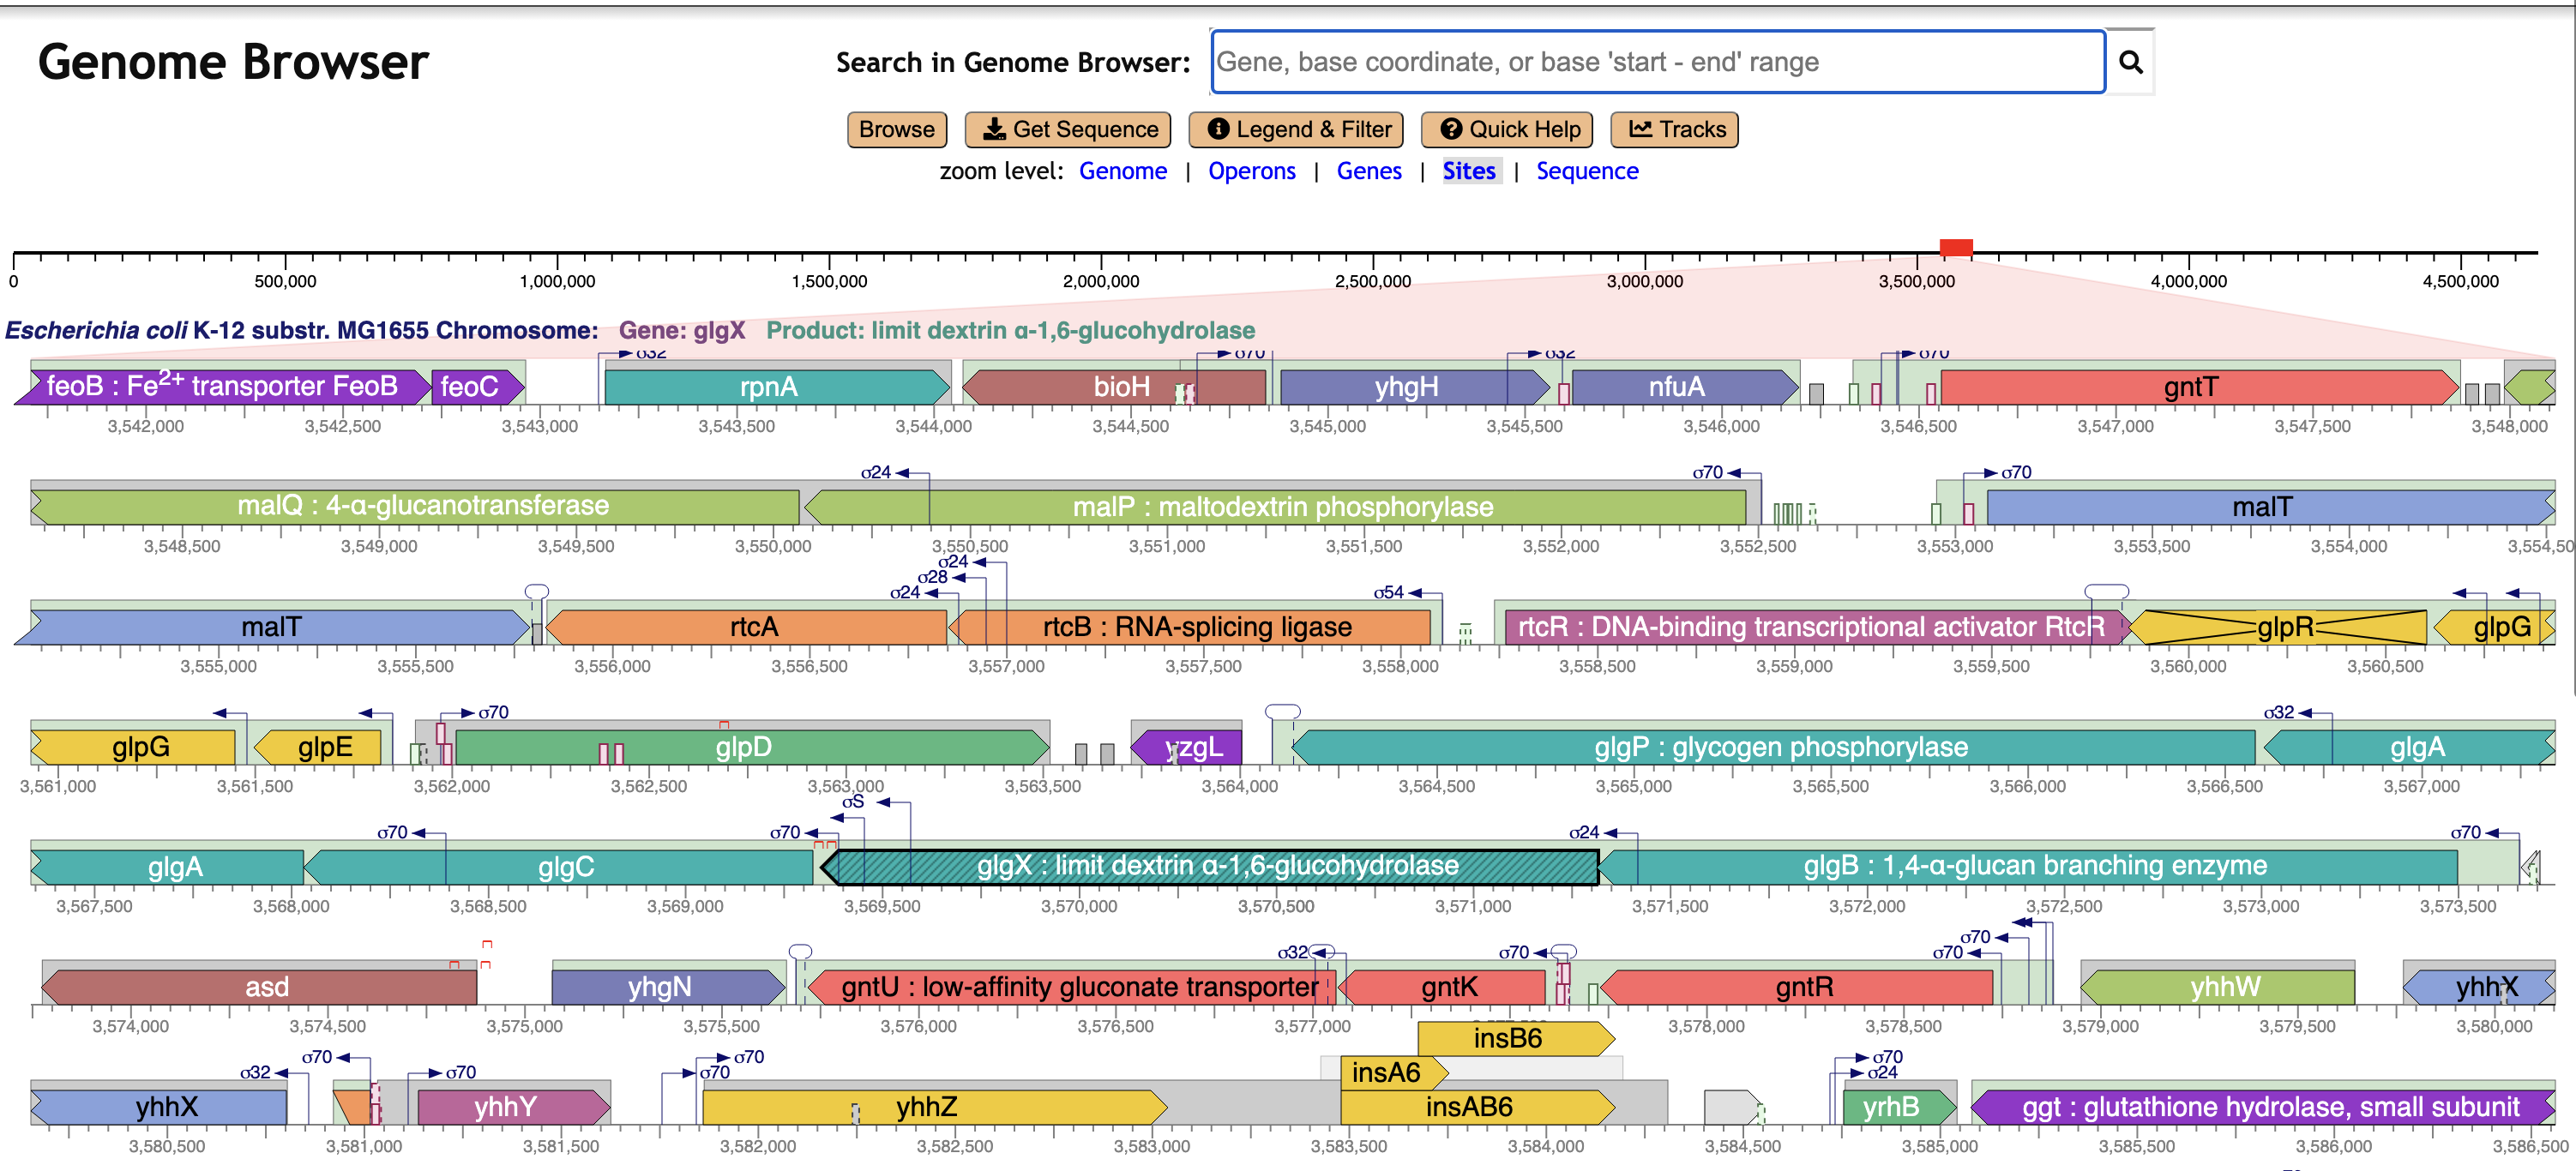
Genome Explorer Genome Browser
Genome Explorer supports real-time zooming to the sequence level using a mouse wheel or trackpad. Its multi-line diagrams provide high information density and intuitive depiction of genome elements.
Here the browser depicts a region of the E. coli K-12 chromosome; gene colors indicate operon organization. Promoters and terminators are depicted when known. Pseudogenes are marked with X's.
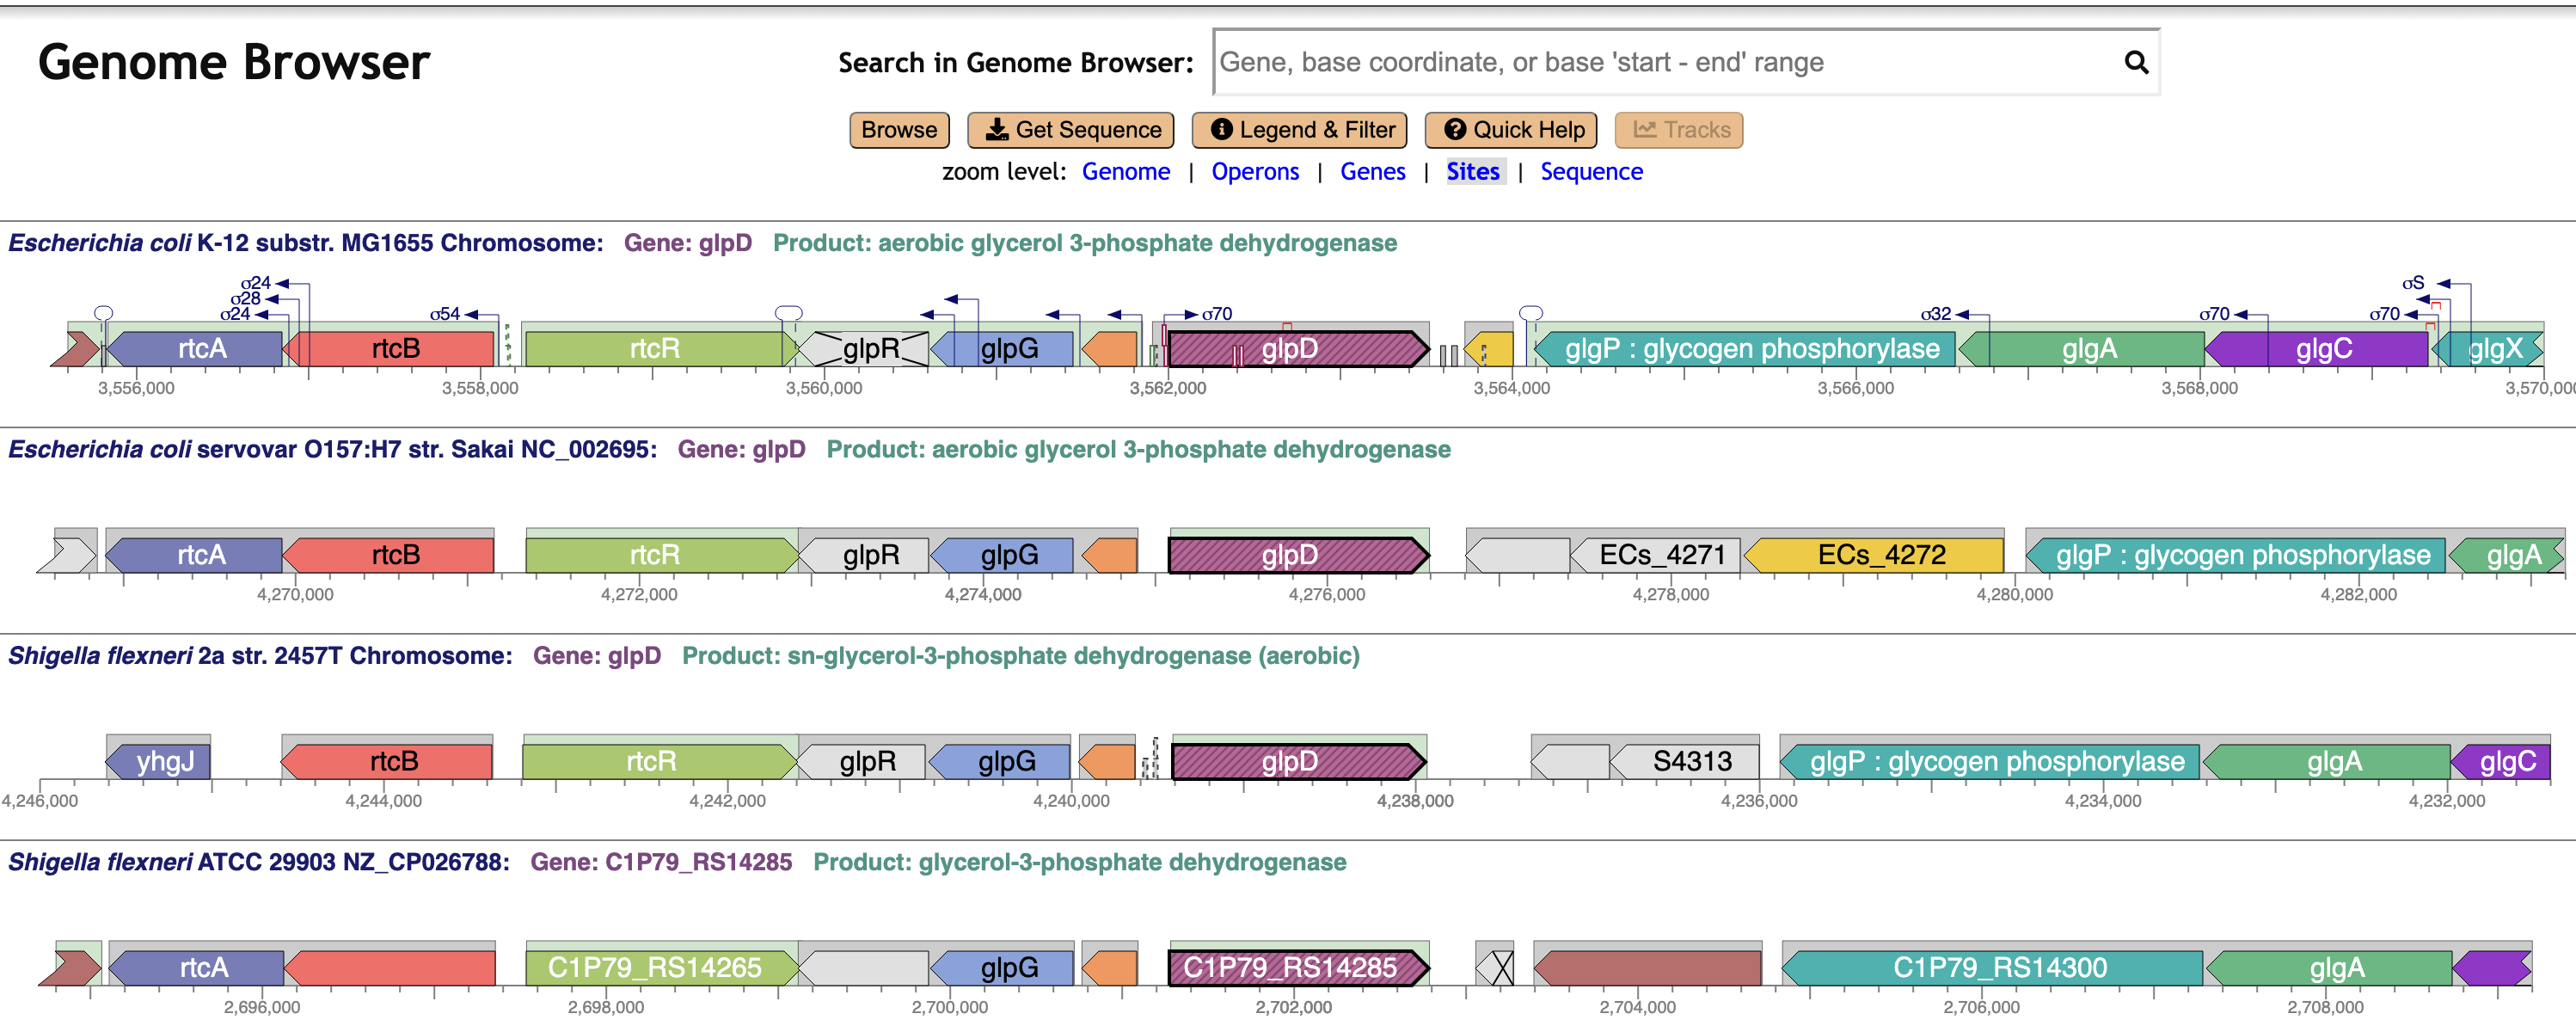
Genome Explorer Comparative Mode
Aligns genome regions from user-selected organisms at orthologous genes.
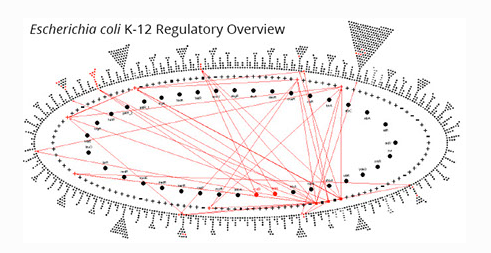
Regulatory Network Viewer
The Regulatory Overview depicts the transcriptional regulatory network in a PGDB; red arrows show user-requested regulatory relationships. The inner two rings are populated by transcription factors and sigma factors; the outer ring contains other, non-regulatory genes.
Pathway Informatics Tools
Pathway informatics tools include the following.
- Search tools and information pages for pathways, reactions, and metabolites
- Build multi-pathway diagrams called pathway collages
- Organism-specific zoomable metabolic network diagrams that can be printed as metabolic wall charts (see below)
- Interactive metabolic network explorer
- Metabolic route search (construct optimal pathways connecting a feedstock metabolite to a goal metabolite)
- Compute dead-end metabolites
- Compute choke-point reactions
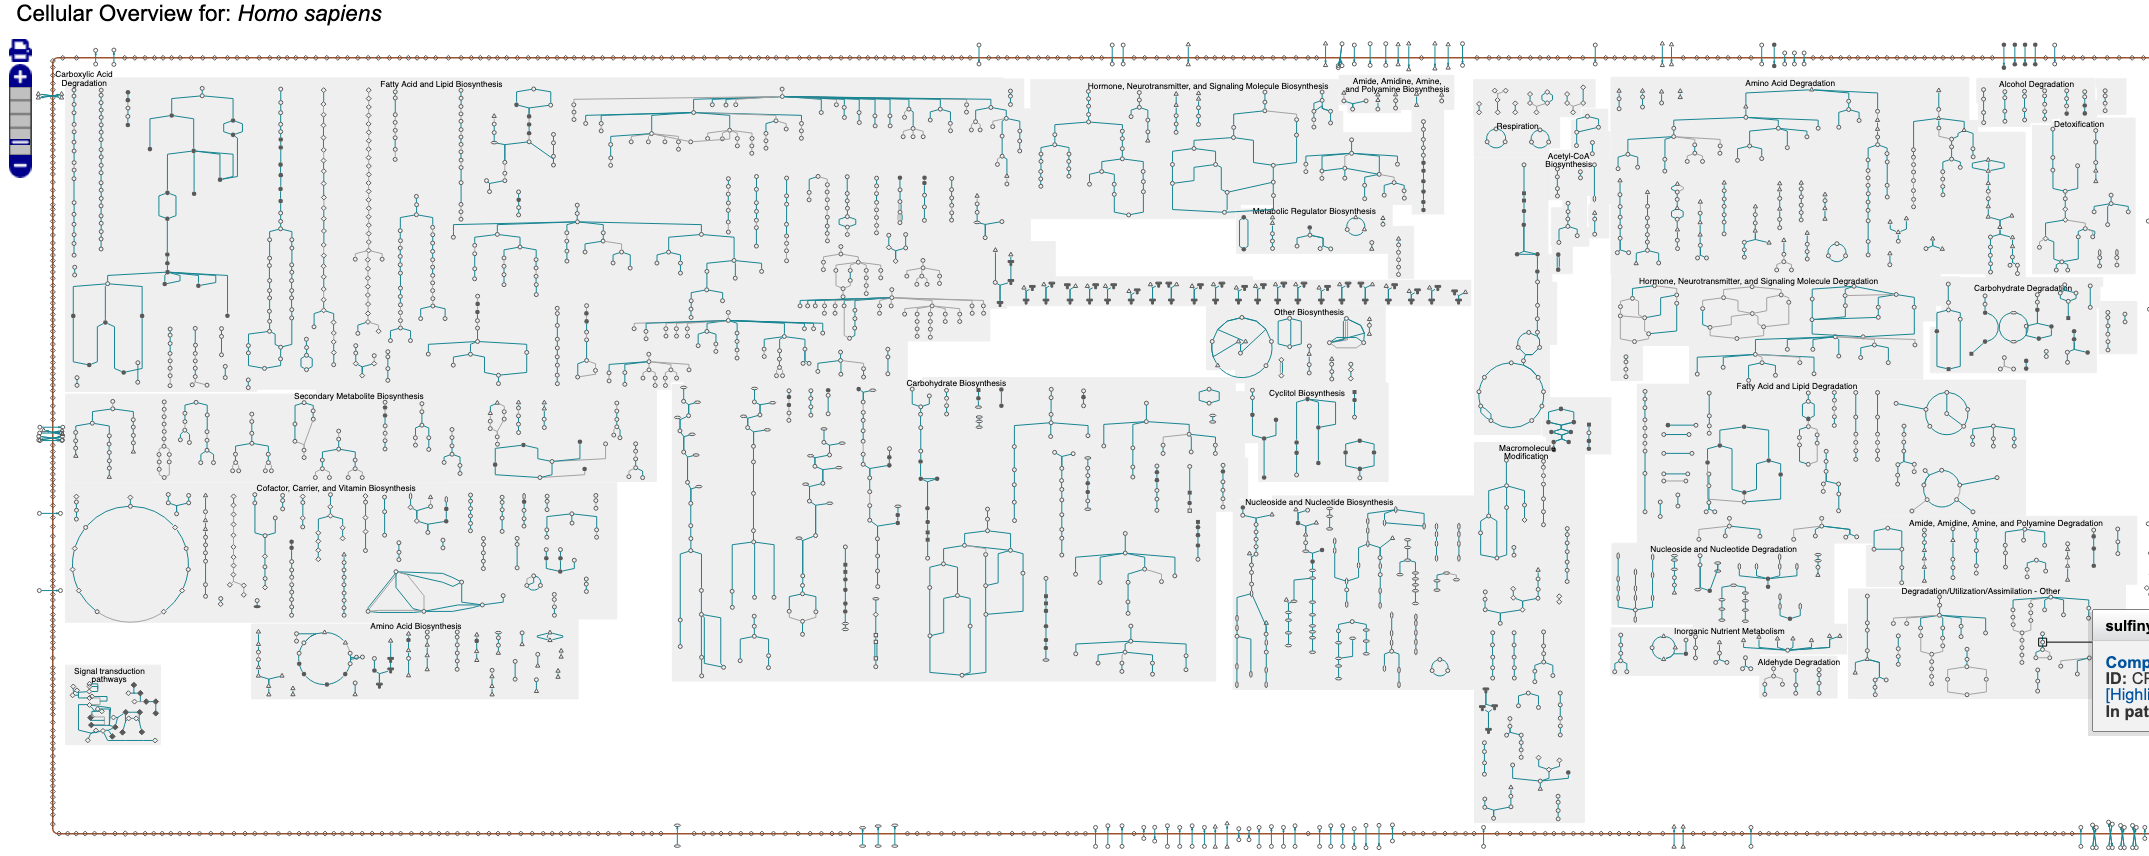
Zoomable metabolic network diagram for Homo sapiens
Transcriptomics Data Analysis Tools
Tools for exploring transcriptomics data include enrichment analysis of gene sets for pathways, Gene Ontology biological processes, and regulators, and the following unique tools.
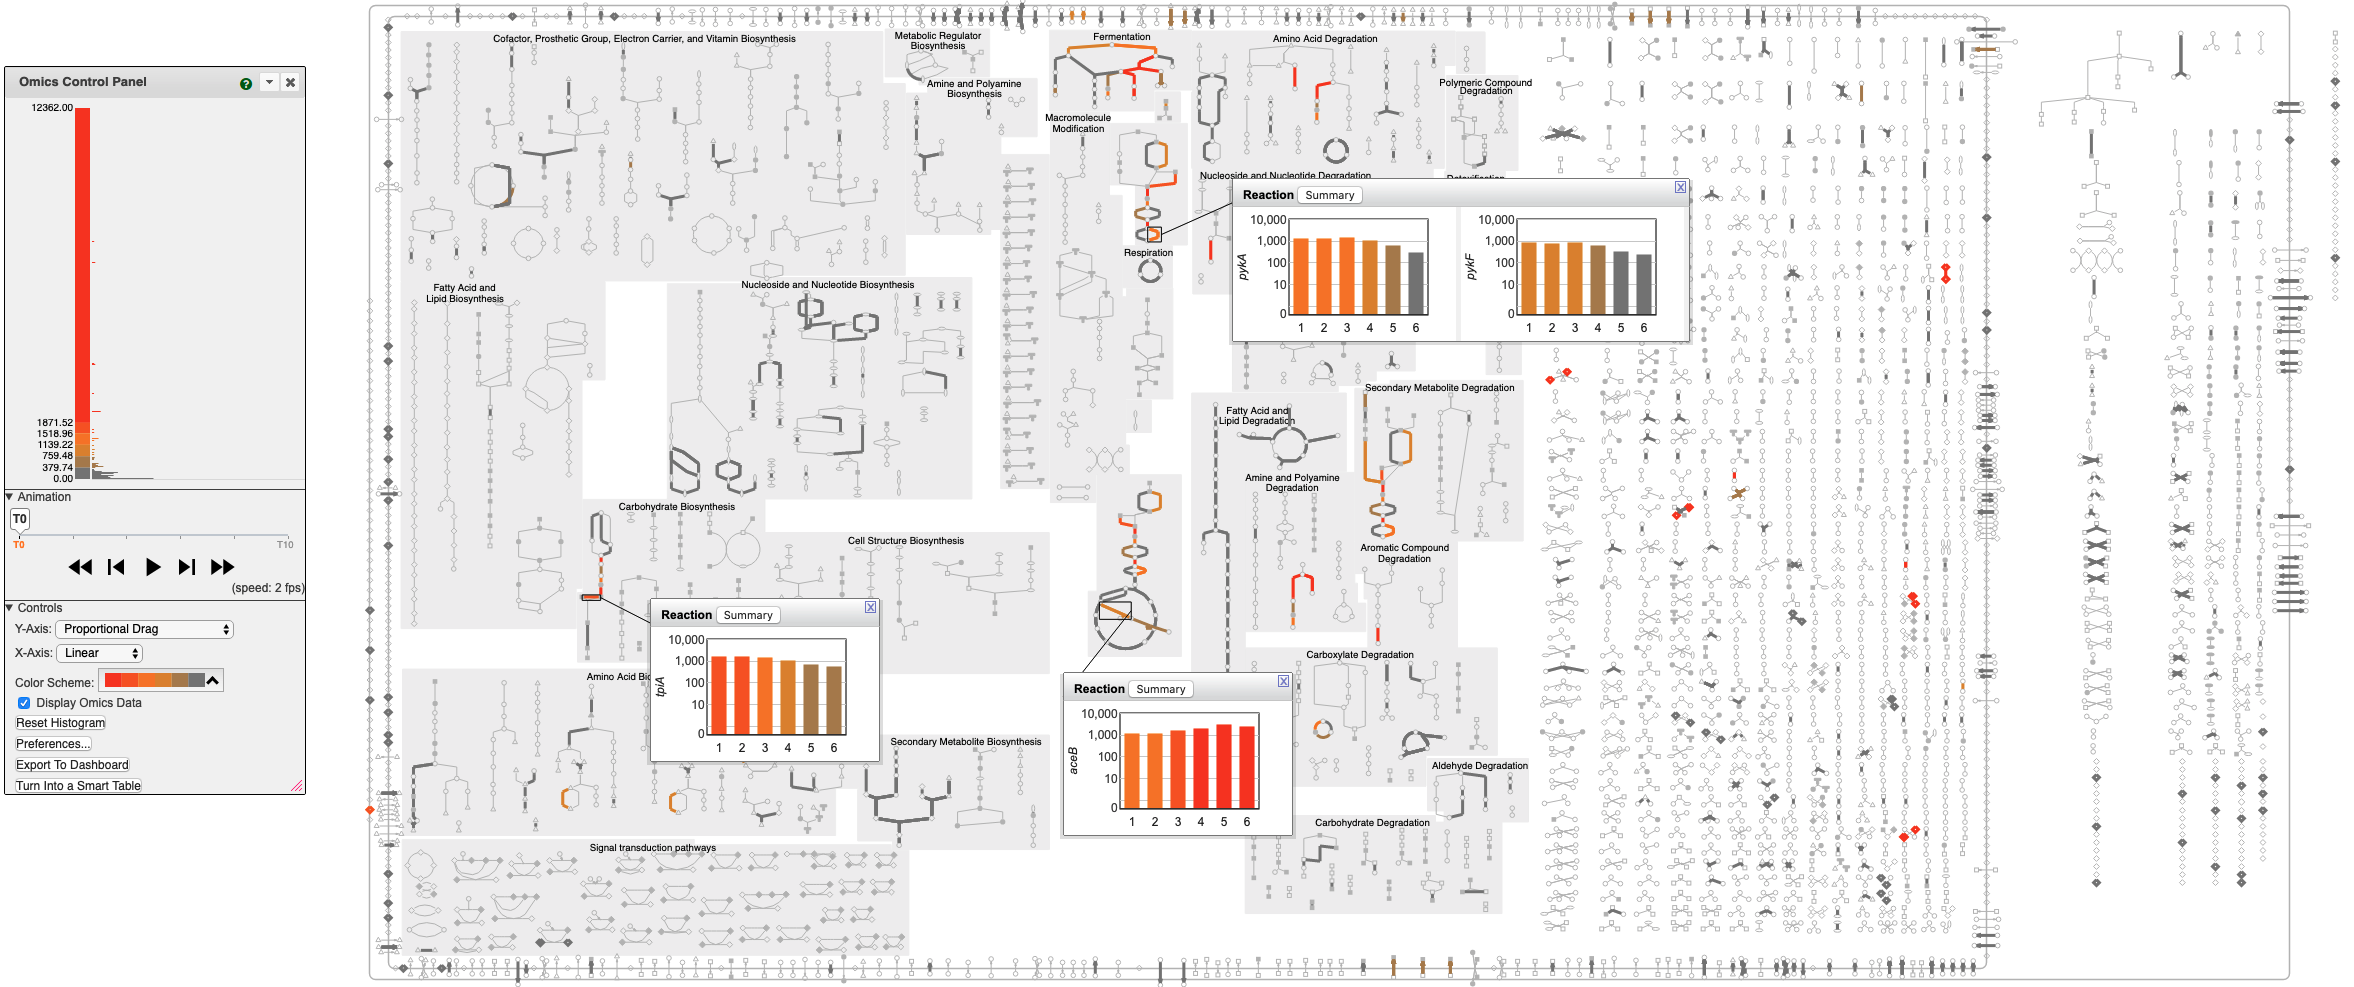
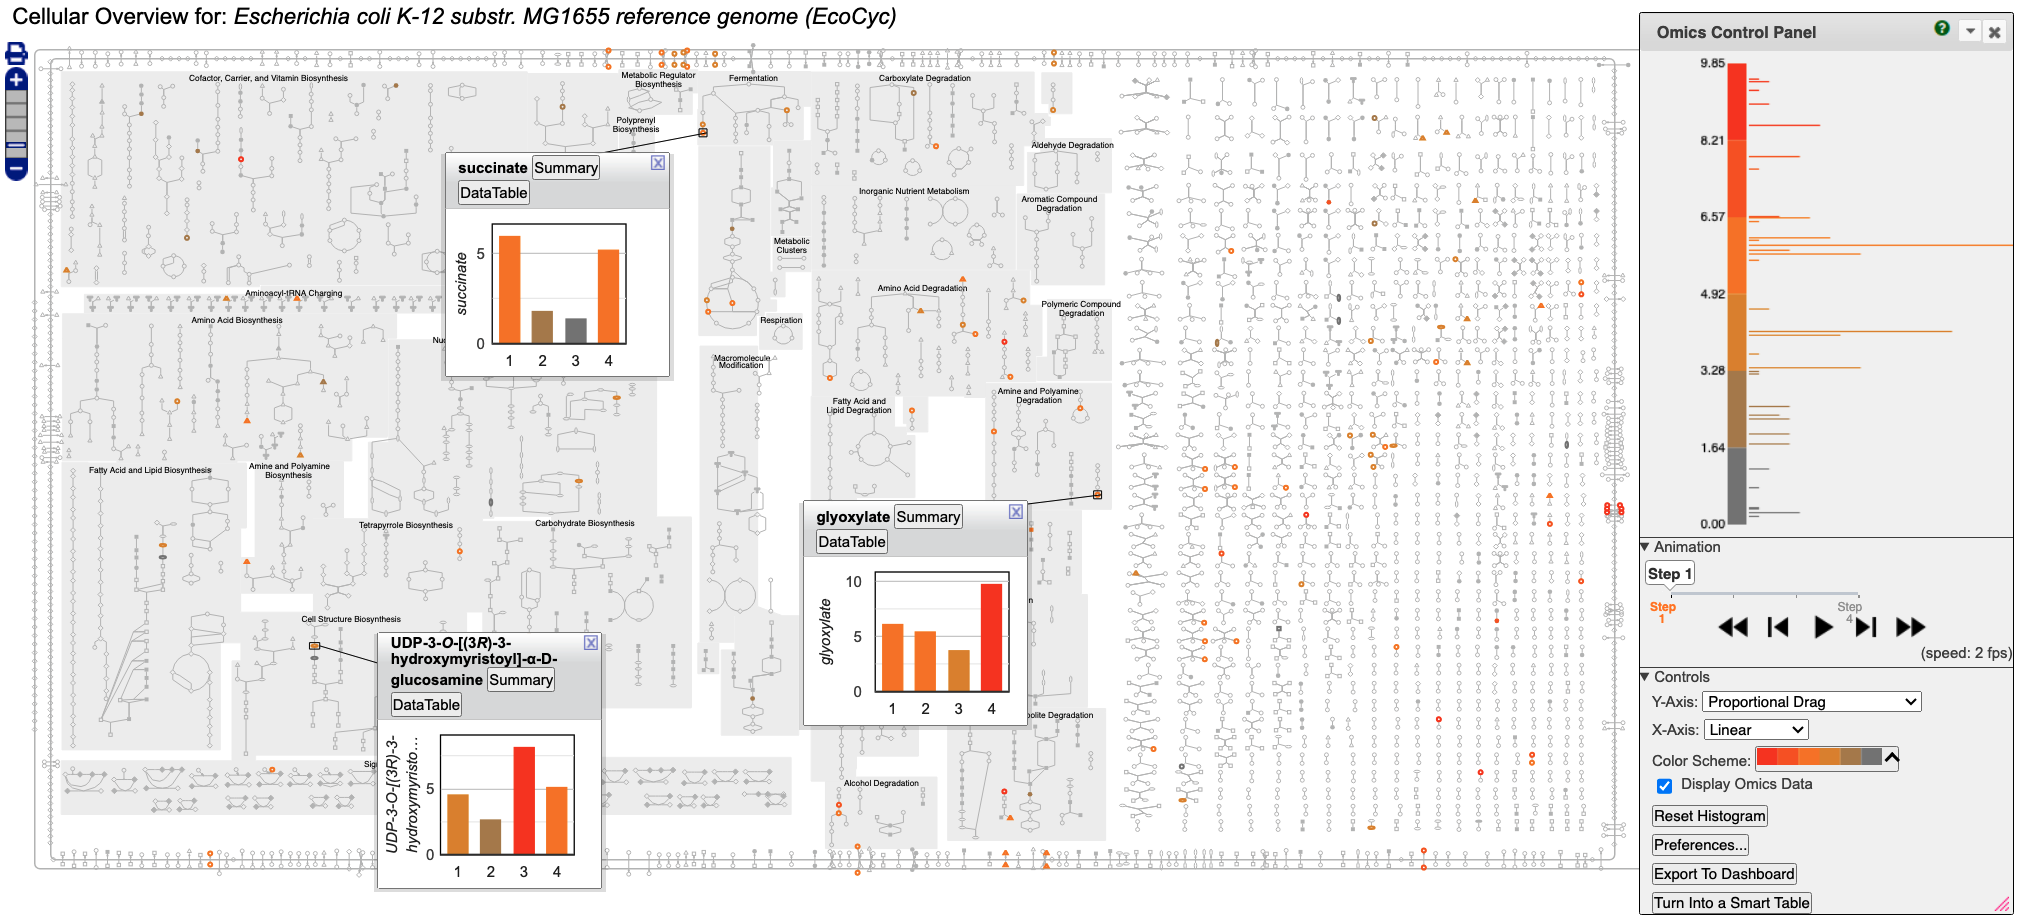
Cellular Omics Viewer
Visualize transcriptomics and metabolomics data directly on zoomable, organism-specific metabolic maps (left) and on pathway diagrams (right). The Cellular Omics Viewer provides a high-level pathway context for complex datasets, allowing you to:
- Overlay Multi-Omics: Color-code reaction lines using gene expression, proteomics,
or flux data, and paint metabolite concentrations onto metabolite nodes.
- Animate Trends: Execute time-course or comparative analysis through dynamic animations.
- Drill Down: Access interactive pop-ups featuring bar graphs, heat maps, and X-Y plots for specific data points.
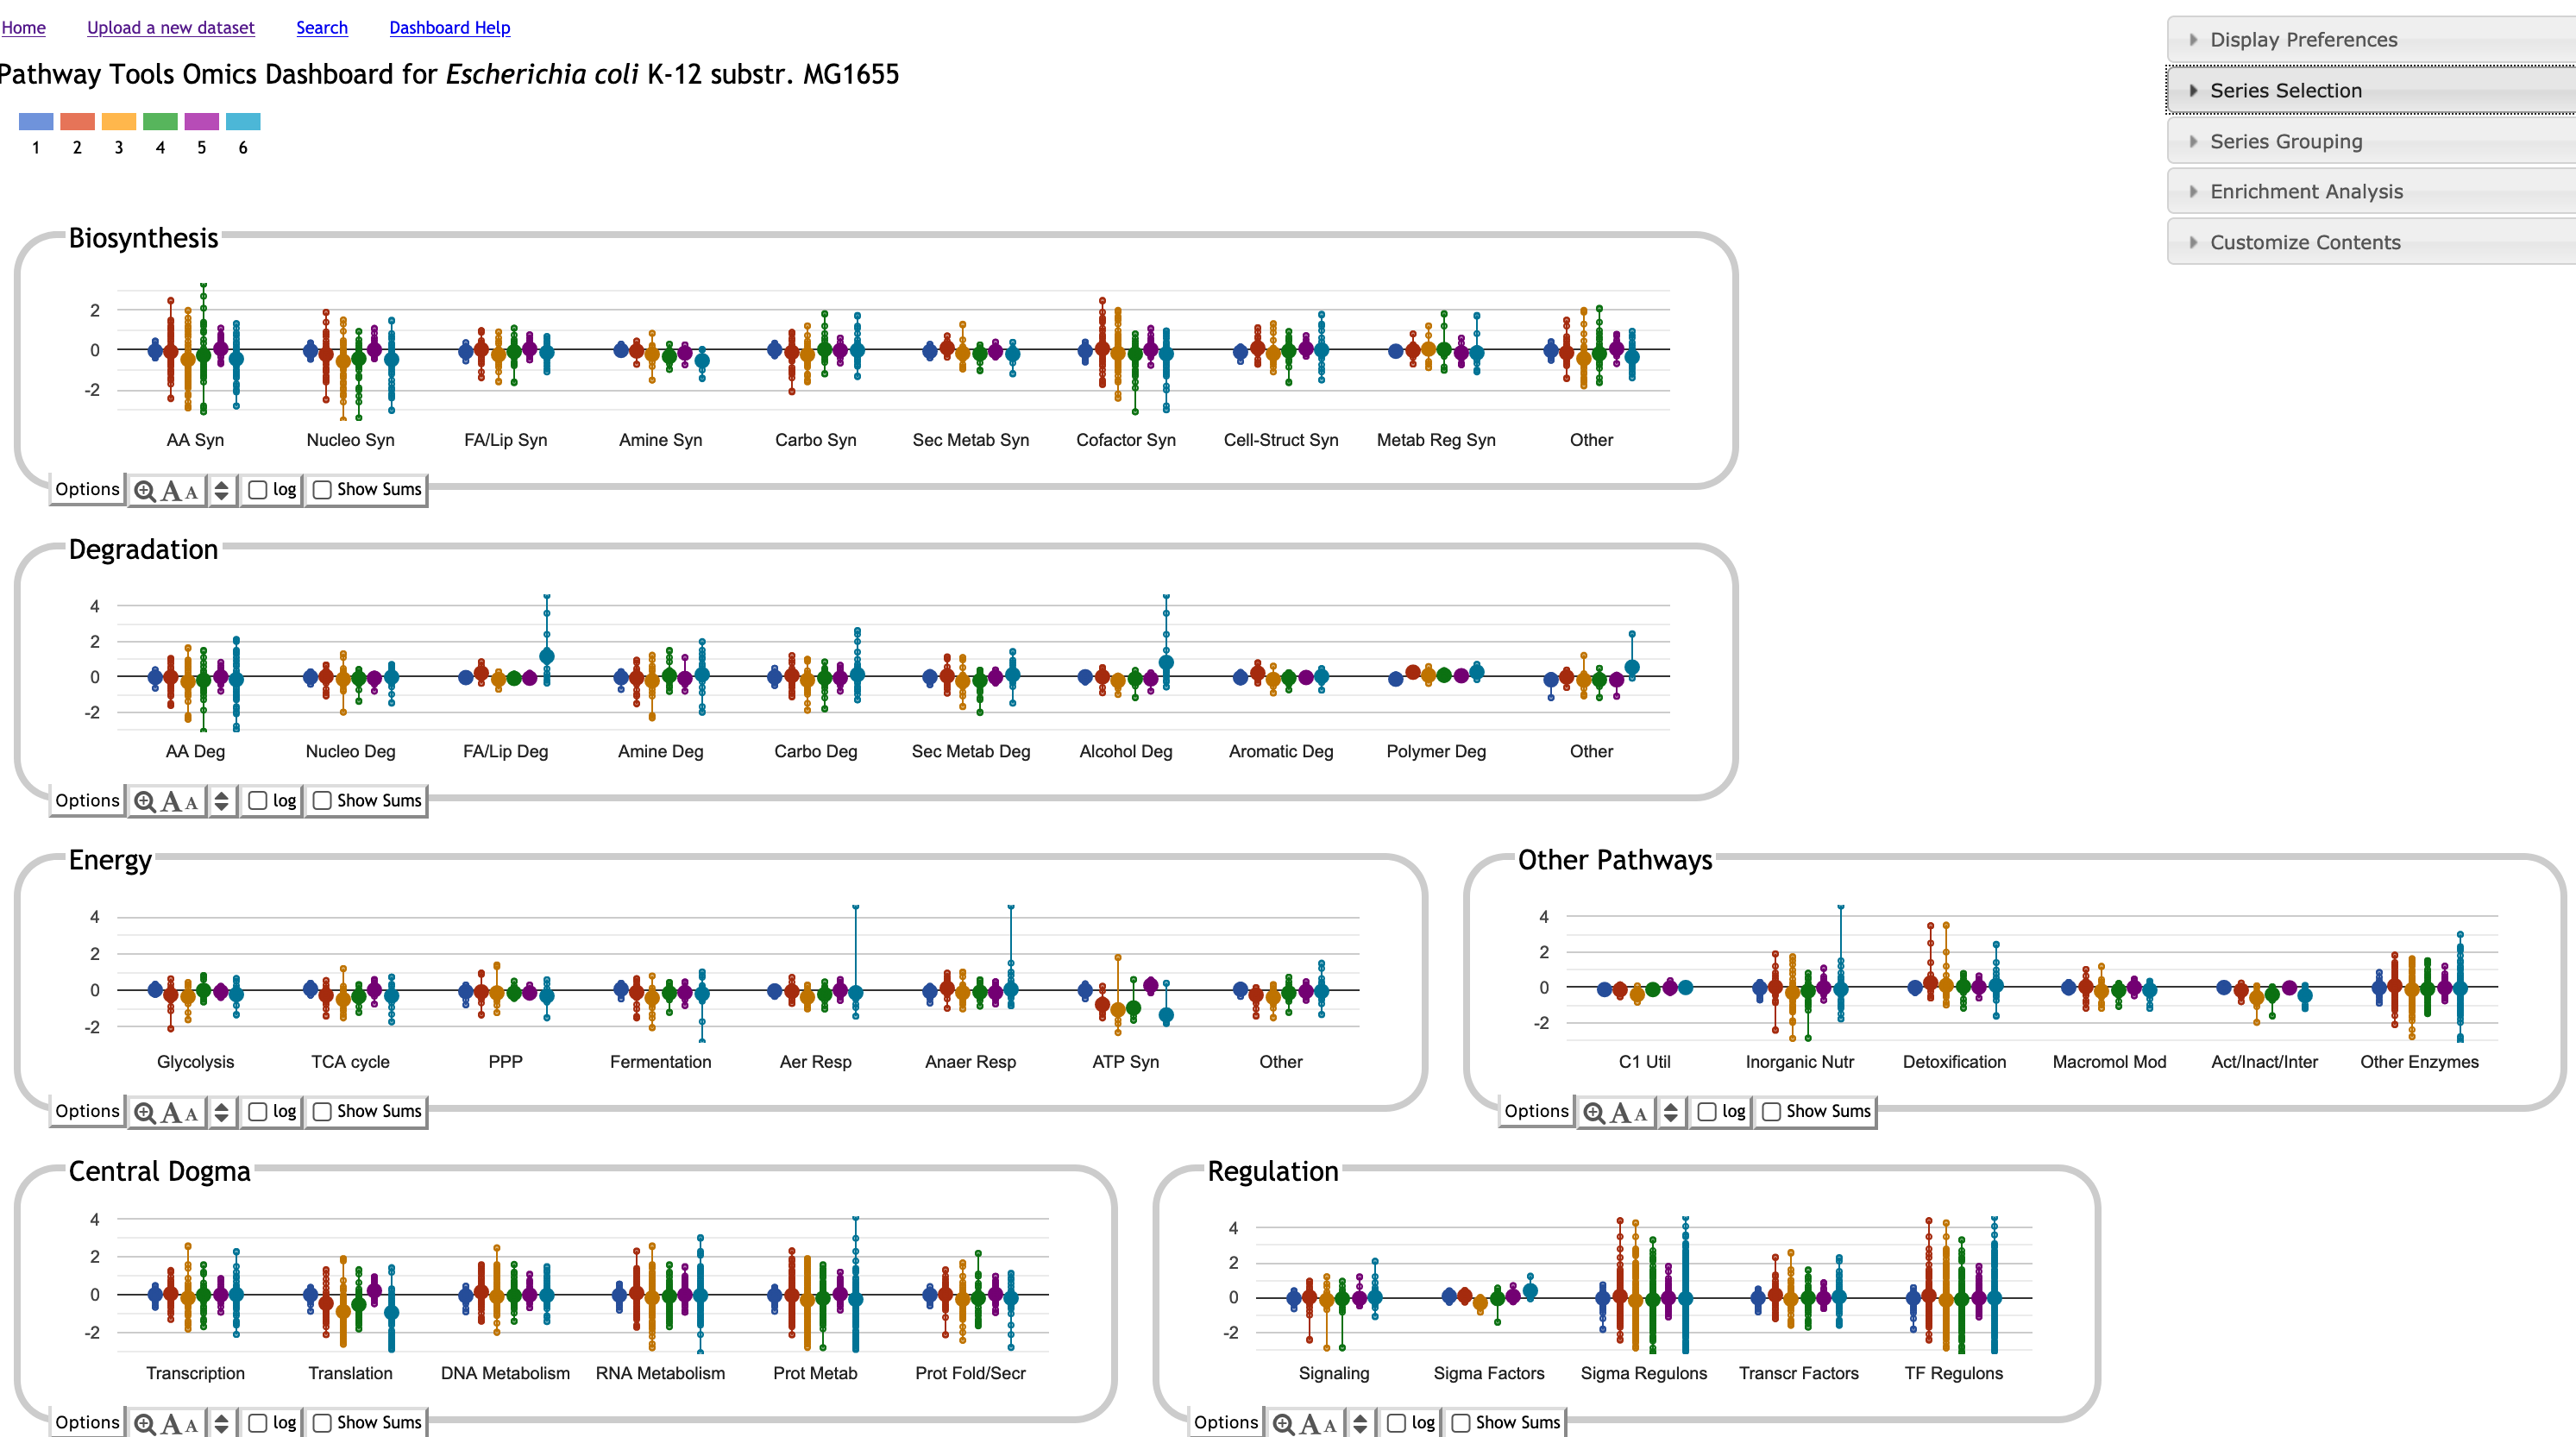
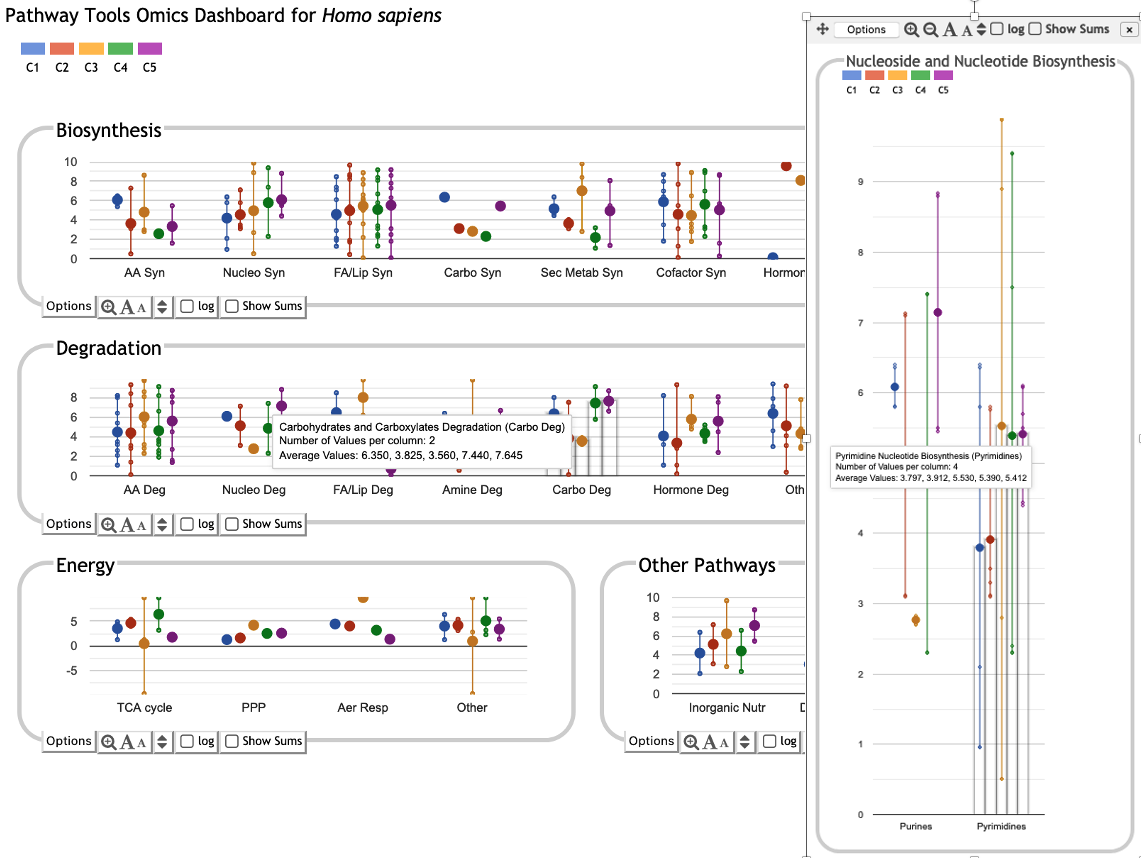
Omics Dashboard
Get an instant, bird's-eye view of how every cellular system responds to a stimulus. The Dashboard organizes complex data into intuitive functional panels, allowing you to:
- Survey Global Responses: Rapidly gauge the relative activity levels across
all cellular systems at once.
- Contextualize Regulation: Compare system-wide expression levels directly against
those of their known regulators.
- Visualize Multi-Series Data: Plot multiple timepoints or experimental conditions
as distinct data series within interactive graphs.
- Drill Down: Navigate from a high-level functional overview to detailed subsystem data with a single click.
Metabolomics Data Analysis Tools
Tools for exploring metabolomics data include enrichment analysis of metabolite sets for pathways, search by chemical formula and monoisotopic mass, computation of metabolite-covering sets, and the following unique tools.
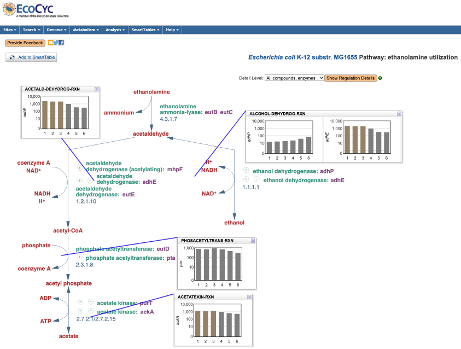
Cellular Omics Viewer
The BioCyc Cellular Omics Viewer enables the user to paint metabolomics datasets onto zoomable organism-specific metabolic network diagrams. Scientists can interpret high-throughput datasets in a pathway context, including animation of time-course or comparative datasets. Metabolite nodes in the diagram can be colored with metabolomics measurements. Omics pop-ups graph data values using bar graphs, heat maps, or X-Y plots.
Add transcriptomics data to the diagram by additionally painting transcriptomics data onto reaction lines.
Omics Dashboard
The BioCyc Omics Dashboard enables the user to rapidly survey how all cellular systems are responding to a given stimulus. Scientists can quickly view the metabolite abundances within one or more specific systems of interest, and to gauge the relative activity levels of different cellular systems. The Dashboard consists of a set of panels, each representing a system of cellular function. Each panel shows a graph depicting omics data for each of a set of subsystems. Multiple timepoints or experimental conditions are plotted as separate data series within the graphs. Clicking on a panel drills down into its component subsystems.
Advanced Data Access
- Extensive search tools available under the menu Tools > Search
- The Structured Advanced Query Form (Tools > Advanced Search) enables intuitive construction of database queries of SQL power using a Web-based interface
- BioCyc data can be downloaded as a set of data files for subscriptions of cost $5,000 and higher
- Extensive web services APIs provided
- Query APIs available for Python, Perl, Java, R, and Lisp